Collecting and analyzing consumption data from utility bills, SMART meters, and building management systems to reveal usage patterns and cut costs — turning raw numbers into decisions you can actually act on.

Most buildings already generate more energy data than anyone looks at — utility invoices, SMART meter feeds, building management system logs. Data Analysis & Reporting pulls all of it into one place, so patterns that are invisible bill-by-bill become obvious: which equipment runs longest, when demand spikes, and where costs are quietly creeping up.
The output isn’t a data dump — it’s a set of findings tied to specific, achievable actions, delivered on a schedule that keeps you ahead of your bill instead of reacting to it.

One view, every source
Utility bills, SMART meters, and BMS data combined into a single, coherent picture.

Patterns you'd otherwise miss
Usage trends and anomalies surfaced well before they show up as a spike on your bill.

Findings tied to actions
Every report ends with specific, prioritized next steps, not just charts.
We pull from wherever your building already produces data — no need to install anything before we can start.
Utility Bills & Invoices
Your billing history, mapped over time to establish a baseline and track savings.
SMART Meters & AMI
Interval-level data that reveals what’s happening hour by hour, not just month by month.
Building Management Systems
Operational data straight from your building’s own controls and equipment.
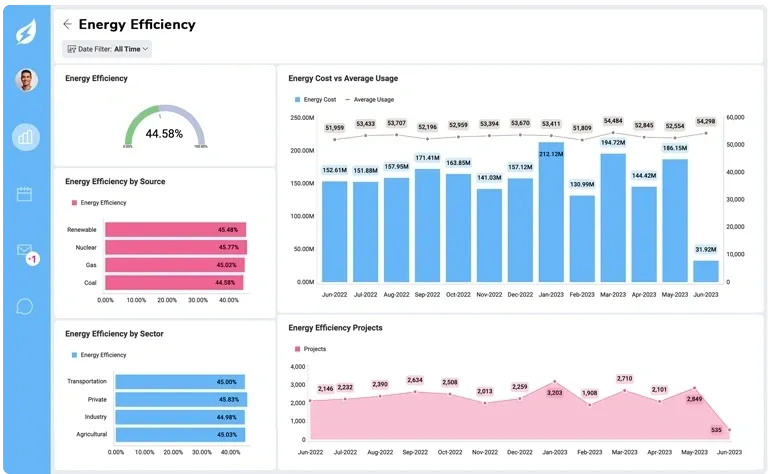
Live Dashboards
An always-current view of usage and cost, so you’re never waiting on a monthly bill to know how the building is performing.
Recurring Reports
Monthly or quarterly summaries that track progress against your baseline and flag anything that needs attention.
Benchmarking
Performance compared against similar buildings or your own prior periods, so you know if “normal” is actually good.
Pull the data
Bills, meter feeds, and BMS logs gathered from every available source.
Find the patterns
Usage trends, anomalies, and cost drivers identified across the combined dataset.
Build the dashboard
Findings turned into clear dashboards and reports, not raw spreadsheets.
Recommend next steps
Every report ends with prioritized, specific actions tied to real savings.

No. We can start with utility bill data alone and add SMART metering or sub-metering later if deeper visibility is needed — installing AMI is one of our services, not a prerequisite for this one.
Consumption data is handled the same way any sensitive operational information should be — access limited to your reporting, not shared or repurposed beyond the service you’ve requested.
Dashboards update continuously as data comes in, while formal reports are typically delivered monthly or quarterly — the cadence is set based on how actively you want to monitor performance.
In most cases, yes. We work with common building management system data formats and can typically pull operational data without replacing your existing controls platform.
Findings are flagged directly in your report with a recommended next step — whether that’s a quick fix, an equipment upgrade, or a deeper audit — so nothing sits unaddressed.